01
Put the work on the canvas.
Drop deliverables and activities where you’d put the sticky notes. Drag to arrange. Each box sits on its real dates, so the picture is the schedule.
- Skips weekends, holidays and your shutdowns
- Clean Up lays out the main chain for you
Critical view on: the critical path in orange, work with float in blue.
02
Link what comes first. The dates follow.
Draw a link on the canvas, or type it in the Table, and every date downstream moves with it. The critical path shows itself in orange, and float tells you how much room the rest has.
- Critical path and total float, always up to date
- A Gantt of the result, for the people who think in bars
03
Prefer rows? Use the Table.
Every task, duration, link and float in one sheet that works like a spreadsheet. Paste a block from Excel, fill down, and the canvas keeps up.
- Predecessors and successors in P6 style (1.2:FS)
- Import a plan from Excel or Word, templates included
Scroll sideways for durations, links and float.
04
Hand it off clean.
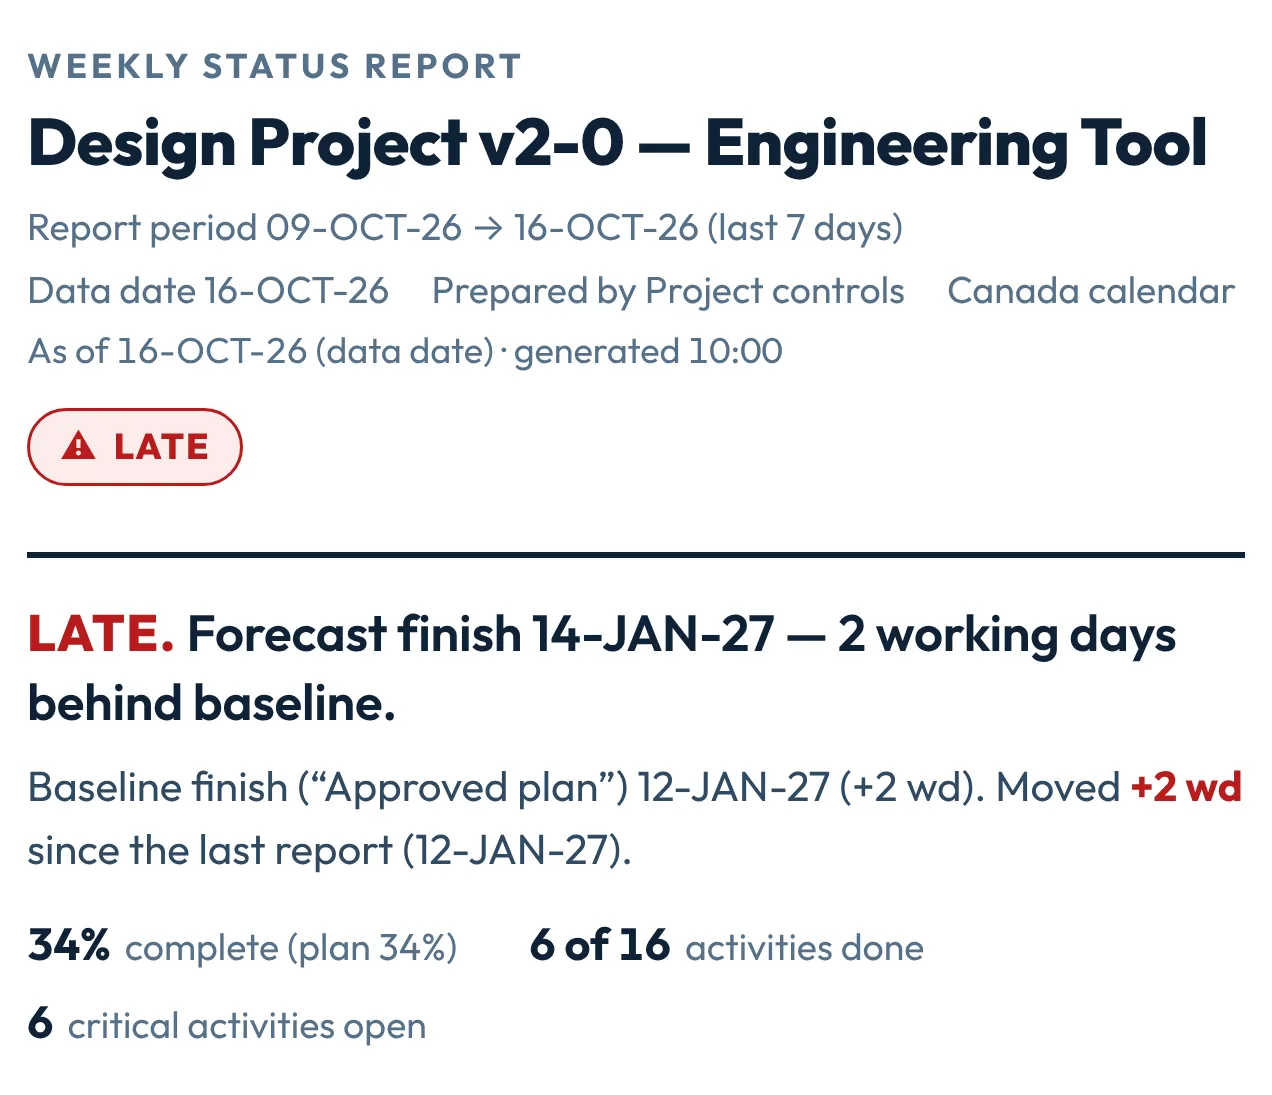
Send a status report management can read in a minute: forecast finish, critical work, and what moved. Export to Excel or PDF for everyone else.
- Status report, dashboard and board memo
- Primavera P6 (.xer) export, still in testing
The real app, on a sample engineering project.